Effective Date: July 21, 2018
Our privacy policy explains how we collect, use, share and protect your personal information. If we update this policy, we’ll post any changes on our website.
Contact details:
https://triodox.com/ is website operated and owned by Mr. Ruslan Konygin who is based in the Russian Federation.
How to contact us:
Email: ceo@triodox.com
What information do we collect about you and with what purpose?
The personal data we collect from you differs depending on the different functionalities of the website you use.
Contact form
When you use the contact form on our website, we collect the following information with the purpose to identify you and to be able to contact you back:
- First name and last name
- Email address
Newsletter form
When you use our newsletter form, we collect your email address with the purpose to be able to provide you with our newsletters as requested by you when providing your consent for receiving such information from us.
Leave a reply form
The Wordpress platform on which our website is built has the ability comments to be posted under blog posts. If you decide to use this functionality we will collect the following information from you with the purpose to avoid spam in the comments section and to avoid one person to leave several comments like it is from several people:
- First name and last name
- Email address
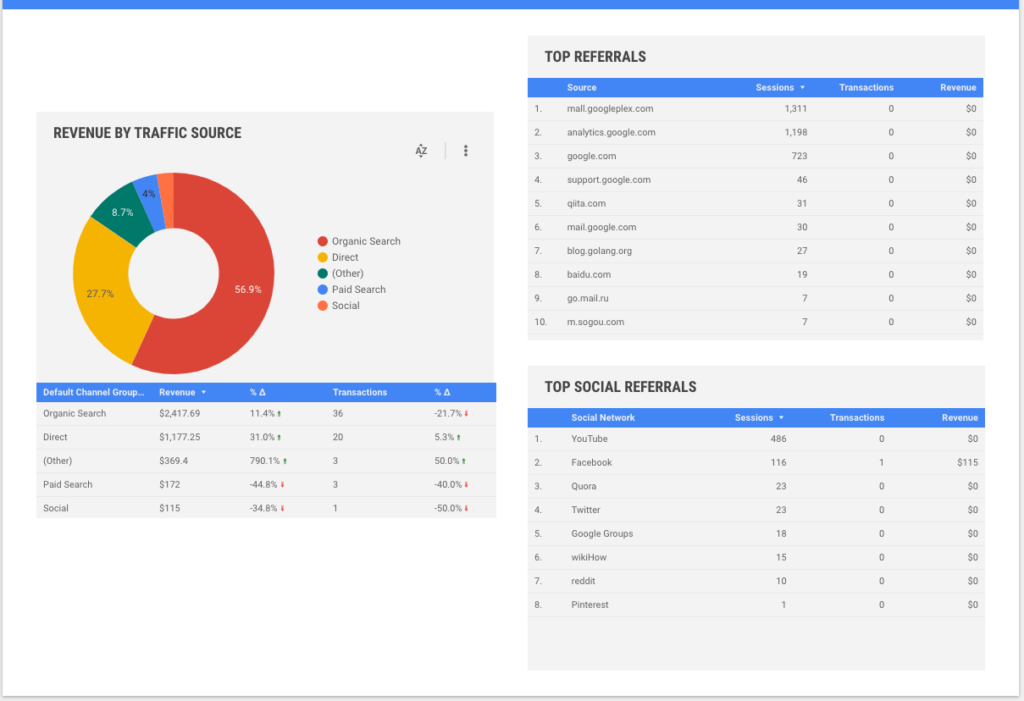
We also use tools like Google Analytics on our website with the purpose to measure traffic to our site and how users interact with our site as we use this information to improve our services.
The Google Analytics terms specify that no personally identifiable information may be collected through the Google Analytics software so your IP Address, Age, Gender and interests that may be collected through the use of Google Analytics will be completely anonymized and rendered unintelligible.
Google Analytics may collect also data about your behavior (like page viewed, button clicked, etc.) and your location.
What are the legal basis for the collection and the processing of the data?
- Our legal basis for the processing of your data collected when you use our contact form, leave a reply form and newsletter form is your consent provided when you voluntarily decided to contact us, to leave a reply or to subscribe for our newsletter. Your consent was expressed via your actions when you entered your personal data in the required fields. The personal data requested in these forms is required to be provided in order you to be able to use these functionalities.
- If you are an existing customer, we may contact you with information about goods and services similar to those which were the subject of a previous sale to you on the grounds of our Legitimate Business Interests.
- We may use our Legitimate Business Interests to measure traffic to our site and to follow how users interact with our site.
You will find out what legal basis, we apply for the use of cookies in the relevant section.
With whom we share your personal data?
We do not share your personal information with others except as indicated within this policy.
We may share your information in the following ways:
With third party service providers, agents, or contractors that are performing or may perform services on our behalf or to assist us with providing services to you. For example, we may engage Service Providers to provide services such as marketing, advertising, communications, hosting and IT services, to provide customer service and to analyze and enhance data (including data about users’ interactions with our service). These Service Providers may have access to your personal or other information in order to provide these functions. In addition, some of the information we request may be collected by third party providers on our behalf. We do not authorize them to use or disclose your personal information except in connection with providing their services.
As mentioned above we use Google Analytics, which is a web analytics service offered by Google that tracks and reports website traffic. Google uses the data collected to track and monitor the use of our website. This data is shared with other Google services. Google may use the collected data to contextualize and personalize the ads of its own advertising network.
We may share your data with State and Supervisory authorities upon their lawful request.
Please be advised that we do not reveal information about identifiable individuals to our advertisers, but we may, on occasion, provide them with aggregate statistical information about our visitors such as your area of residence or age group.
For how long we will store your personal data?
For the different types of personal data that we collect, a different retention period may apply. Generally speaking, we store your data for the period for which you use our services and afterwards for the applicable limitation period for related claims.
Your rights under the General Data Protection Regulation (GDPR)
Your rights as a data subject are the following:
- Right of access – you have the right to request a copy of the information that we hold about you.
- Right of rectification – you have a right to correct data that we hold about you that is inaccurate or incomplete.
- Right to be forgotten – in certain circumstances you can ask for the data we hold about you to be erased from our records.
- Right to restriction of processing – where certain conditions apply you have a right to restrict the processing.
- Right of portability – you have the right to have the data we hold about you transferred to another organisation when certain circumstances are met.
- Right to object – you have the right to object to certain types of processing such as direct marketing.
- Right to object to automated processing, including profiling – you also have the right not to be subject to the legal effects of automated processing or profiling.
- You have the right to withdraw your consent for processing of your data where such was given without this to affect the lawfulness of processing based on consent before its withdrawal.
- You have the right to lodge a complaint related to collection or the processing of your personal data with the relevant supervisory authority.
- We do not use automated decision-making including profiling.
If you want to exercise the above listed rights (except the right to lodge a complaint before supervisory authority) please submit a request here.
Cookies
We and our partners may use cookies and third party cookies (a small text file sent by your computer each time you visit our site) or similar technologies to record data or to collect and store information when you visit this site.
If you want to find out more about cookies, you can visit this site.
If your browser, as many others accept cookies on default, you may be able to change this setting in your browser, and you can also clear your cookies. Check your browser’s help function to learn more about your cookie setting options.
We will ask you for your consent in order to use cookies and will also provide you with the opportunity to withdraw your consent for processing of your data where such was given without this to affect the lawfulness of processing based on consent before its withdrawal.
We may use the following types of cookies:
- Advertising and analytics
- Essential cookies
- Functionality cookies
- Social Media cookies
What cookies we currently use:
Google/DoubleClick cookie
We use these cookies with the purpose of remarketing for users and tracking different actions on our website as for instance when users submit contact form, when users clicked to our email link, when user open our "About" page or "Pricing" page, etc.
These type of cookies may collect also your Age, Gender, Affinity Categories (Life styles similar to TV audiences, for example: Technophiles, Sports Fans, and Cooking Enthusiasts), etc.
You can find more about what these cookies track on the following link: https://support.google.com/analytics/answer/2799357?hl=en
Google Adwords conversion Tracking cookie
We use these cookies for the purpose of better planning our advertising budget, based on our users behavior.
Facebook Advertising
We use certain Facebook cookies for the purpose of better planning of our advertising budget, for the remarketing and retargeting, based on users behavior.
You can learn more about the Facebook cookies that we use on their website here https://www.facebook.com/policies/cookies/
Google Analytics
Our partners may also set cookies from the Facebook.com domain that work with the Google Analytics service in order to help them to understand how businesses use Facebook's developer sites.
Pixel tag
The tools that we listed above may use a pixel tag, which is a small graphic file that allows us and third parties to monitor the use of the site and provide us with information based on your interaction with the site. These tags may collect the IP address from the device which you loaded the page, and the browser type. Pixel tags are also used by our third parties to collect information when you visit our site, and the links and other actions you take on our site, and we may use this information in combination with cookies to display targeted advertisements.
Other data technologies may be used that collect comparable information for security and fraud detection purposes.